An income statement—also known as a profit and loss statement (P&L)—is one of the most important financial reports a business produces. It shows how profitable a company is over a specific period by detailing revenues, expenses, and ultimately, net income. Understanding its key components helps business owners, managers, and stakeholders evaluate performance and make informed decisions.
1. Revenue (Sales)
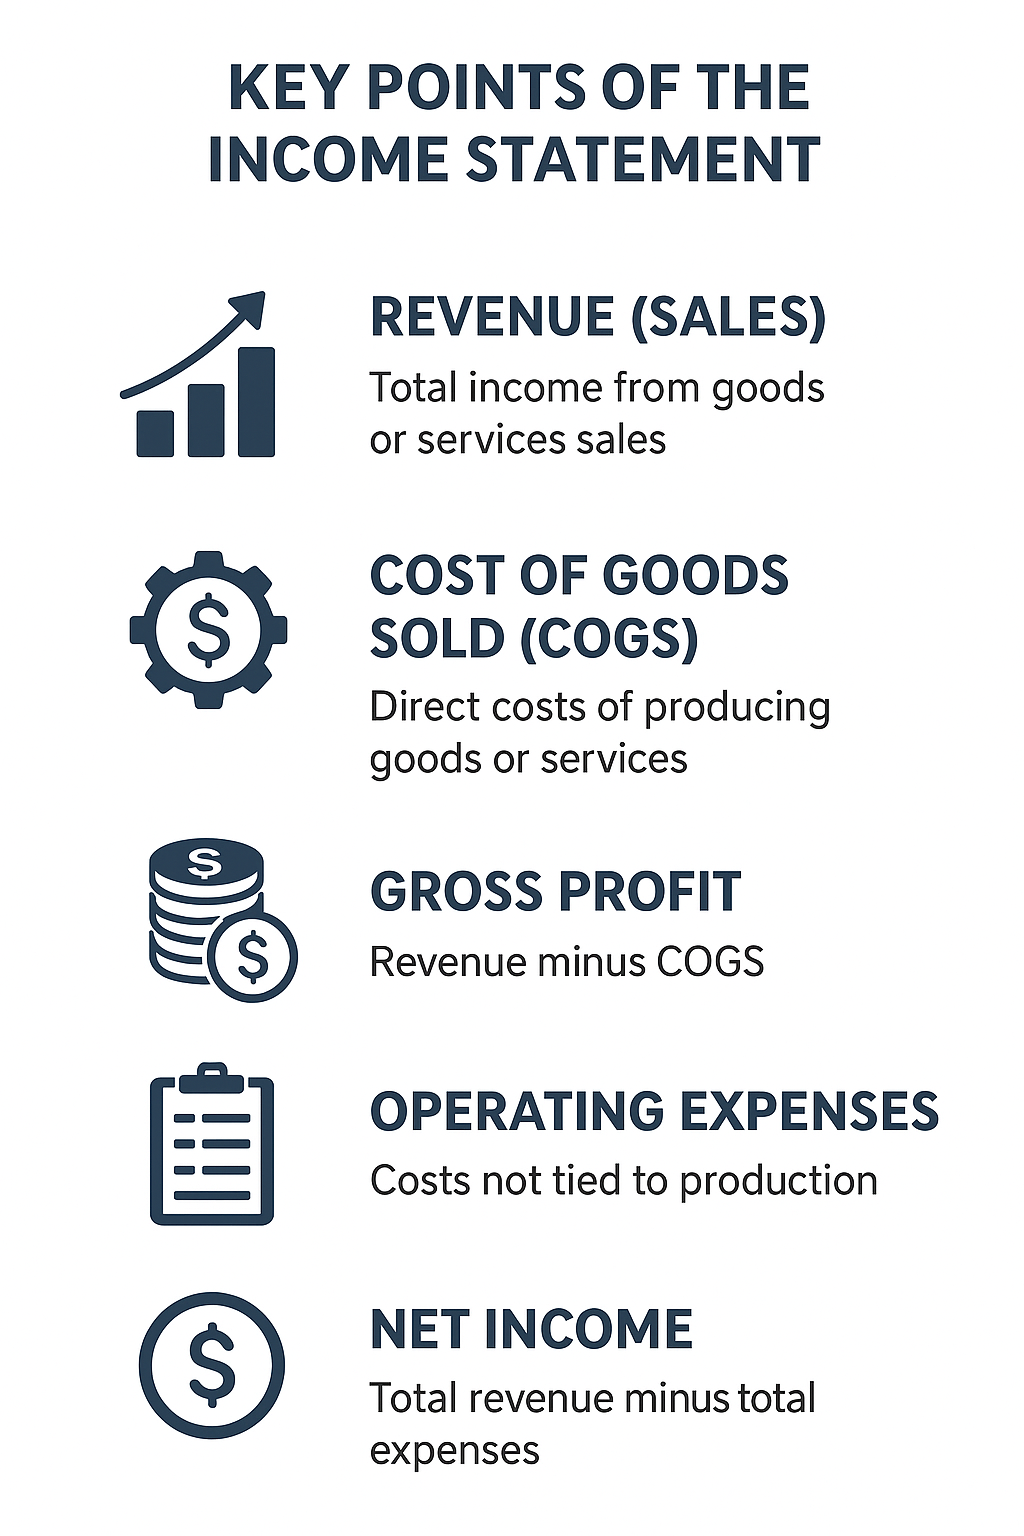
Revenue represents the total amount earned from the sale of goods or services before any expenses are deducted.
Key distinctions include:
-
Operating Revenue: Income generated from primary business activities.
-
Non-Operating Revenue: Income from secondary activities such as interest or investment gains.
Revenue trends offer insight into overall business growth and market demand.
2. Cost of Goods Sold (COGS)
COGS includes the direct costs related to producing goods or delivering services—materials, labor, and production expenses.
Subtracting COGS from revenue gives the gross profit, a core measure of how efficiently a company manages production costs.
3. Gross Profit
Gross profit shows how much the company earns after covering direct costs.
A rising gross profit typically indicates strong pricing, cost control, or increased demand.
Formula:
Gross Profit = Revenue – COGS
4. Operating Expenses
Operating expenses (OPEX) are the day-to-day costs of running the business that aren’t tied directly to production. These include:
-
Administrative expenses
-
Marketing and advertising
-
Rent and utilities
-
Salaries not included in COGS
Monitoring operating expenses helps businesses understand overhead levels and identify areas for cost reduction.
5. Operating Income (EBIT)
Operating income, also called earnings before interest and taxes (EBIT), reflects a company’s profitability from core operations.
Formula:
Operating Income = Gross Profit – Operating Expenses
This figure is important because it excludes external factors like interest or taxes, revealing the true efficiency of business operations.
6. Other Income and Expenses
These items include financial gains or losses not tied to regular activities, such as:
-
Interest income or expense
-
Investment gains or losses
-
Currency exchange adjustments
They can significantly affect the bottom line but do not reflect core business performance.
7. Net Income
Net income—often called the "bottom line"—is the final result after all expenses, taxes, and additional income are accounted for.
Formula:
Net Income = Total Revenue – Total Expenses
This is the ultimate measure of profitability and is used by owners, investors, and lenders to gauge financial health.
8. Earnings Per Share (EPS) (for corporations)
Public companies report EPS, which measures earnings attributed to each share of stock.
It’s a key indicator of shareholder profitability and market valuation.
9. Comparative and Trend Analysis
Reviewing income statements across multiple periods helps identify:
-
Revenue growth patterns
-
Cost behavior
-
Profit consistency
-
Changes in margins
This long-term insight supports better budgeting, forecasting, and decision-making.
Conclusion
The income statement provides a detailed snapshot of a company's profitability and financial performance. By understanding its key points—revenues, expenses, and net income—business owners and stakeholders can evaluate operational efficiency, monitor financial health, and plan for the future with greater confidence. At Charted Legacy Solutions, we are trained to interpret and provide valuable insight into all your financial statements. Contact Us to find out how we can help you understand them so that it will be easier to grow your business.